Data Visualization
Atmospec Visualization Module
Project Objectives
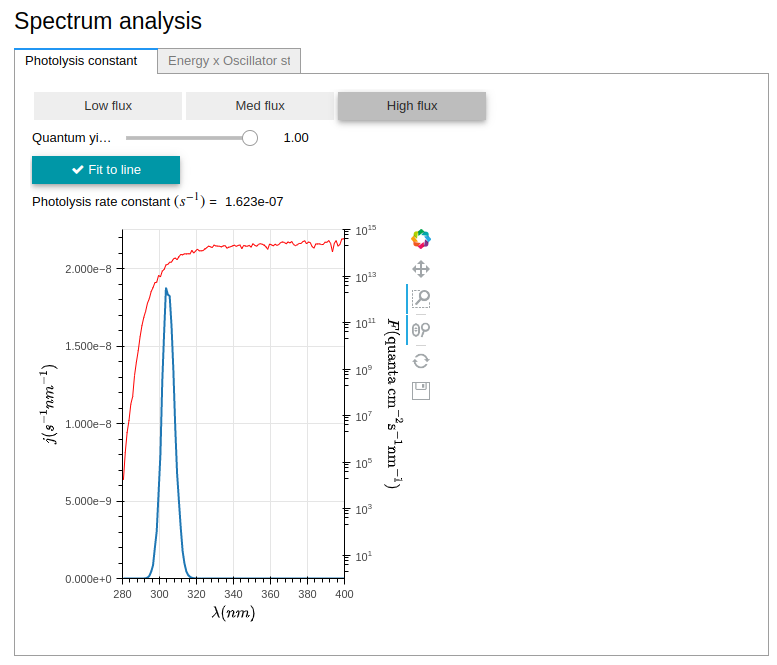
The primary aim of this project was to design and integrate a module for the visualization of photolysis rate data, obtained through the AtmoSpec application. This module would allow the user to dynamically visualize additional results from their Quantum Chemistry calculations. The Atmospec application was distributed using a docker container, and presented as a jupyter web application. The module was directly integrated into the results page.
Background
Atmospec:
Atmospec is an application developed for atmospheric researchers as a tool for the calculation of photo absorption cross-sections. It provides a simplified, automated workflow; with an integrated database, a graphical user interface, and the capability to run quantum mechanical calculations. This allows academics with limited computational chemistry knowledge to leverage the most recent advances in the field, with little barrier for entry. While Atmospec showed a calculated photoabsorption cross-section, it gave no information about the photolysis rate, although the data was readily available.
For more information on AtmoSpec, check out this blog post!
Photolysis rate:
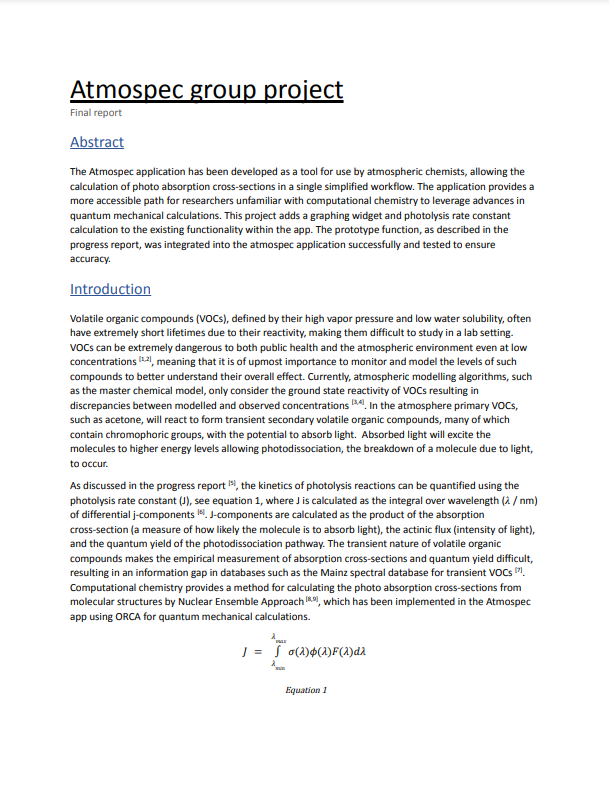
The photolysis rate is an extremely important quantity for atmospheric chemists, as it can help scientists understand and predict the photochemical reactivities and lifetimes of Volatile Organic Compounds (VOCs). The investigation of such properties informs chemical models, such as the Master Chemical Mechanicsm, allowing us to better predict and model the atmospheric composition. The equation above illustrates the calculation of photolysis rate. It is an integral over the product of F (Actinic lux), σ (Photoabsorption cross-section), and Φ (Quantum yield). This can be thought of as the number of photons available at a certain wavelength, multiplied by the likelihood that the molecule absorbs at that wavelength, adjusted for the quantum efficiency of the process.
Since AtmoSpec produced the absorption cross section, our task was to compile the necessary actinic flux and quantum yield data, calculate the photolysis rate, and present this as an integrated module within the AtmoSpec application.
Results
Collaborated with a team of four to design and integrate the photolysis rate visualization module into the AtmoSpec application. Key results include:
- Liased with application users to understand the widget requirements
- Developed an interactive data visualization module for a web based jupyter application using Bokeh, iPyWidgets, and numpy
- Responsible for the integration of the calculation module, using a Linux environment and Docker.
Other Projects
- Bioinformatics · Simulating Protein-Ligand Complexes using Open Source tools
- Data Science · An investigation on wine
- Web development · This Website
- Data Science · Representative Samping for the Nuclear Ensemble Approach
- Cloud paradigms · Improving scalability using cloud paradigms
- Data Science · Biscuit Dunking Data Analysis
- Data Visualization · Atmospec Visualization Module
- Increasing Efficiency · Accelerating Python code
- More ›
Konstantin N
PROJECTS
Atmospec iPyWidgets Data Visualization Docker Git Python

